| FunWithElectronics.com |  |
| - Collection of Information for those with Electronics as a Hobby |
Up one level (GNU Radio and USRP)
Make a simple GNU Radio GUIThis article is finally updated to use the top_block instead of the deprecated flow_graph and version 2 of the graphical sinks (May 9th 2011).
You need to have GNU Radio installed on your linux box with wxpython to be able to do what this tutorial explains. For more info on this check out GNU Radio's homepage. There are blocks and classes ready in the GNU Radio toolkit to make it easy to make a graphical display. A graphical display is very nice if you want to see what is happening to a signal. The easiest way is to write down a python script with one class which is inherited from the stdgui2.std_top_block The very first thing that needs to be in the source code is the gnuradio-import commands. This is accomplished with this: #!/usr/bin/env python from gnuradio import gr from gnuradio.wxgui import stdgui2,fftsink2,scopesink2 import wx The first line tells that this a python script. The three next lines tells what packages will be imported. The gr-package is the standard GNU radio things, that needs to be included in every gnuradio-project. Stdgui is the one that contains our window class, and fftsink and scopesink do what they sound like doing. FFTsink is for the FFT-display (spectrum-display), and scopesink is for the oscilloscope-display. The wx-import is just for using some of the constants that is provided by wx-python Now that the script is initialized it is time to write down the window class: class gnuradioGUI(stdgui2.std_top_block): def __init__(self,frame,panel,vbox,argv): stdgui2.std_top_block.__init__(self,frame,panel,vbox,argv) fft = fftsink2.fft_sink_f(panel, title="FFT display", fft_size=512, sample_rate=100000) vbox.Add(fft.win,4,wx.EXPAND) That was the most critical lines for setting up a window with a FFT display. For adding a oscilloscope display below the FFT display add the following lines: scope = scopesink2.scope_sink_f(panel, title="Oscilloscope", sample_rate=100000) vbox.Add(scope.win,4,wx.EXPAND) GNU radio needs blocks to be connected to each other. The FFT-display and Scope-display does not yet have any input signal. This means that the program will not run. Just for the example I have added the following lines so that the display gets an input signal. It's a sine-wave at 20kHz, with an amplitude of 1000. To avoid that the program is sucking down all the CPU available a throttle has been added. This limits the speed to the samplerate-value of 100000. signal = gr.sig_source_f(100000,gr.GR_SIN_WAVE,20000,1000,0) throttle = gr.throttle(gr.sizeof_float,100000) self.connect(signal,throttle) self.connect(throttle,fft) self.connect(throttle,scope) At the bottom of the script you will need to add these lines, so that the python-interpreter knows that it has to use the class we have made. if __name__ == '__main__': app = stdgui2.stdapp(gnuradioGUI,"A simple GNU Radio GUI") app.MainLoop() If you won't copy and paste you can download the full source code here: simplegui.py 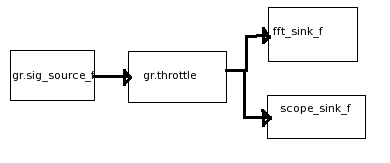
Now, you should be able to run the program and get a display like this: 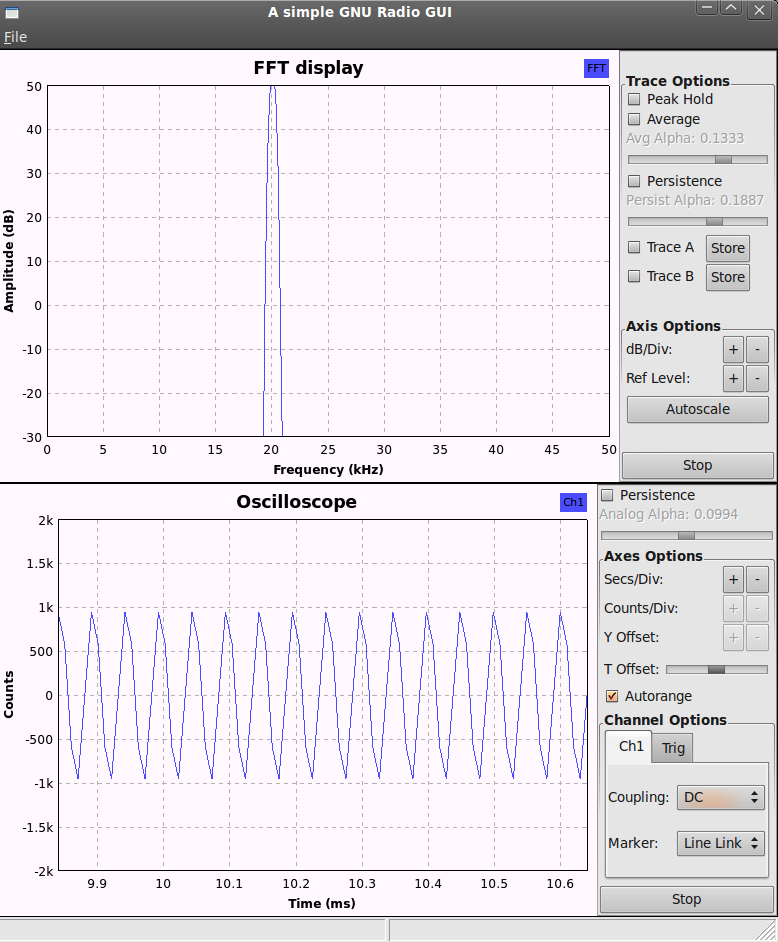
Notice the peak at 20KHz which is the sine wave that we put at the input of the displays! Now you can go ahead and replace the gr.sig_source_f block with something else! It can for example be the input from a file, a noise source or perhaps the input from an USRP. The beauty of GNU radio is that you can plug in and plug out blocks just like you want. The only things you have to watch out for is the sampling rate and whether the source is real or complex. From file:signal = gr.file_source(gr.sizeof_gr_complex,"INPUTFILENAME")
signal = uhd.usrp_source(device_addr="",io_type=uhd.io_type.COMPLEX_FLOAT32,num_channels=1)
    - also put this in the beginning of the script:     from gnuradio import uhd
|
- Home
- Components
- GNU Radio and USRP
- High Voltage
- Linux
- Mathematics/physics
- Programming
- Projects and circuits
- Radio (RF)